bashtop
A Bash-based resource monitor with real-time graphs for CPU, memory, disk, network, and processes.
bashtop is a terminal resource monitor written entirely in Bash. It displays live statistics for CPU, memory, disk, and network in a graphical terminal UI with a game-inspired menu system navigable by keyboard or mouse.
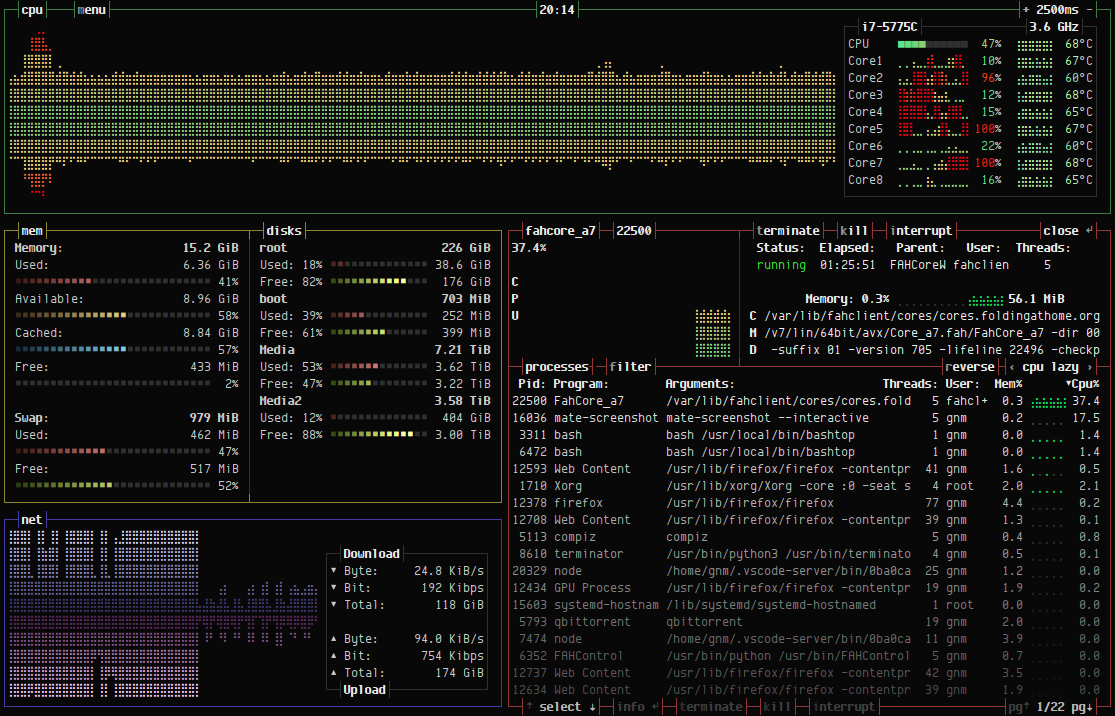
The process list supports filtering, sorting by multiple criteria, and sending signals (SIGTERM, SIGKILL, SIGINT) to selected processes. Network graphs auto-scale, and disk read/write speeds are tracked alongside capacity. Temperature monitoring is available via lm-sensors on Linux or osx-cpu-temp on macOS.
Configuration lives in ~/.config/bashtop/bashtop.cfg and includes
options for themes, update intervals, sort order, and data collection
method. Additional themes are available for download from the project page.
bashtop is the original in a trilogy by the same author: it was followed by the Python rewrite bpytop and then the C++ rewrite btop.
Basic usage
bashtop          # Launch the monitor.
bashtop --help   # Show command-line options.