btop
A resource monitor with real-time graphs for CPU, memory, disk, network, and processes in an interactive terminal UI.
Project: https://github.com/aristocratos/btop
Author: Jakob P. Liljenberg
Alternative to: top (See 10 others)
Language: C++
This page last updated:
btop is a C++ system monitor with a polished, game-inspired terminal UI. It displays live graphs for CPU (overall and per-core), memory and swap, disk I/O, network traffic, and a sortable, filterable process list — all in a single screen with full mouse support.
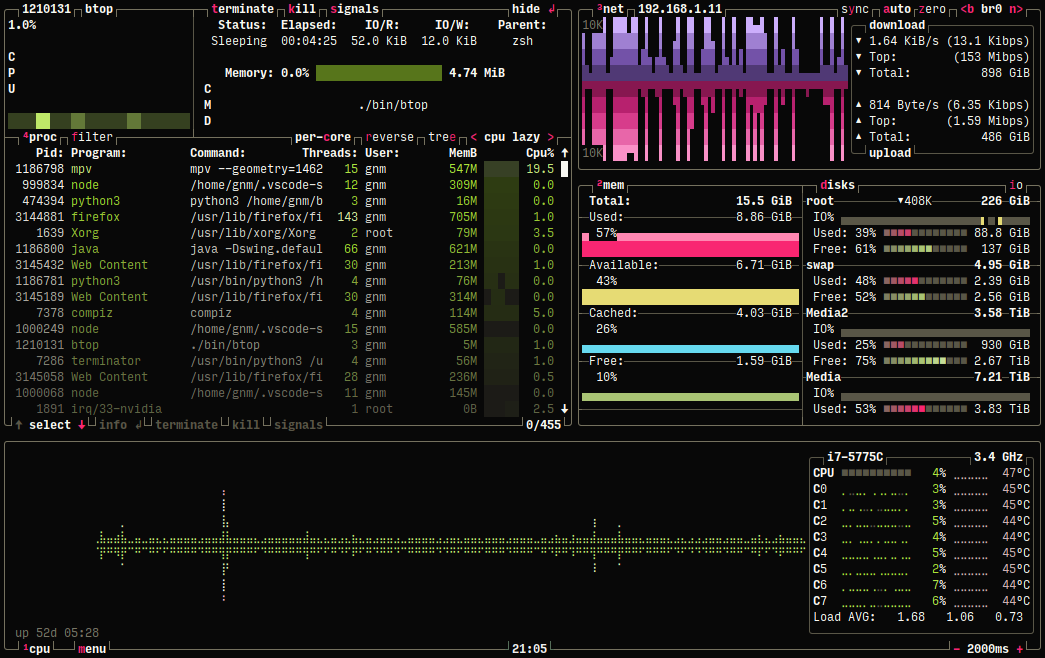
The process list supports filtering by name, sorting by any column, tree view for parent/child relationships, and sending signals directly from the interface. On Linux, btop also supports GPU monitoring for NVIDIA, AMD, and Intel cards.
btop is themeable and ships with several built-in themes, using the same theme format as its predecessors bashtop and bpytop. It runs on Linux, macOS, FreeBSD, NetBSD, and OpenBSD.
Basic usage
btop          # Launch the monitor.
btop --help   # Show command-line options.
Press ? inside btop to open the help menu with all key bindings.